Learning material: How to Analyze Crypto on CryptoAnalyse
Practical learning material: from screening coins to a signal with entry, stop and targets. We cover indicators, Smart Money, order flow (CVD), algorithm tips and common mistakes.
Contents
- Quick start in 5 minutes
- How the analysis pipeline works
- Step 1. Market screener
- Step 2. Technical analysis
- Step 3. Order flow deep dive
- Step 4. AI signal explained
- Scalp Radar for fast trading
- Indicators: what and why
- Smart Money: OB, FVG, liquidity
- Algorithm tips
- Worked example: screener to trade
- Common mistakes
- Interface gallery
- FAQ
Quick start in 5 minutes
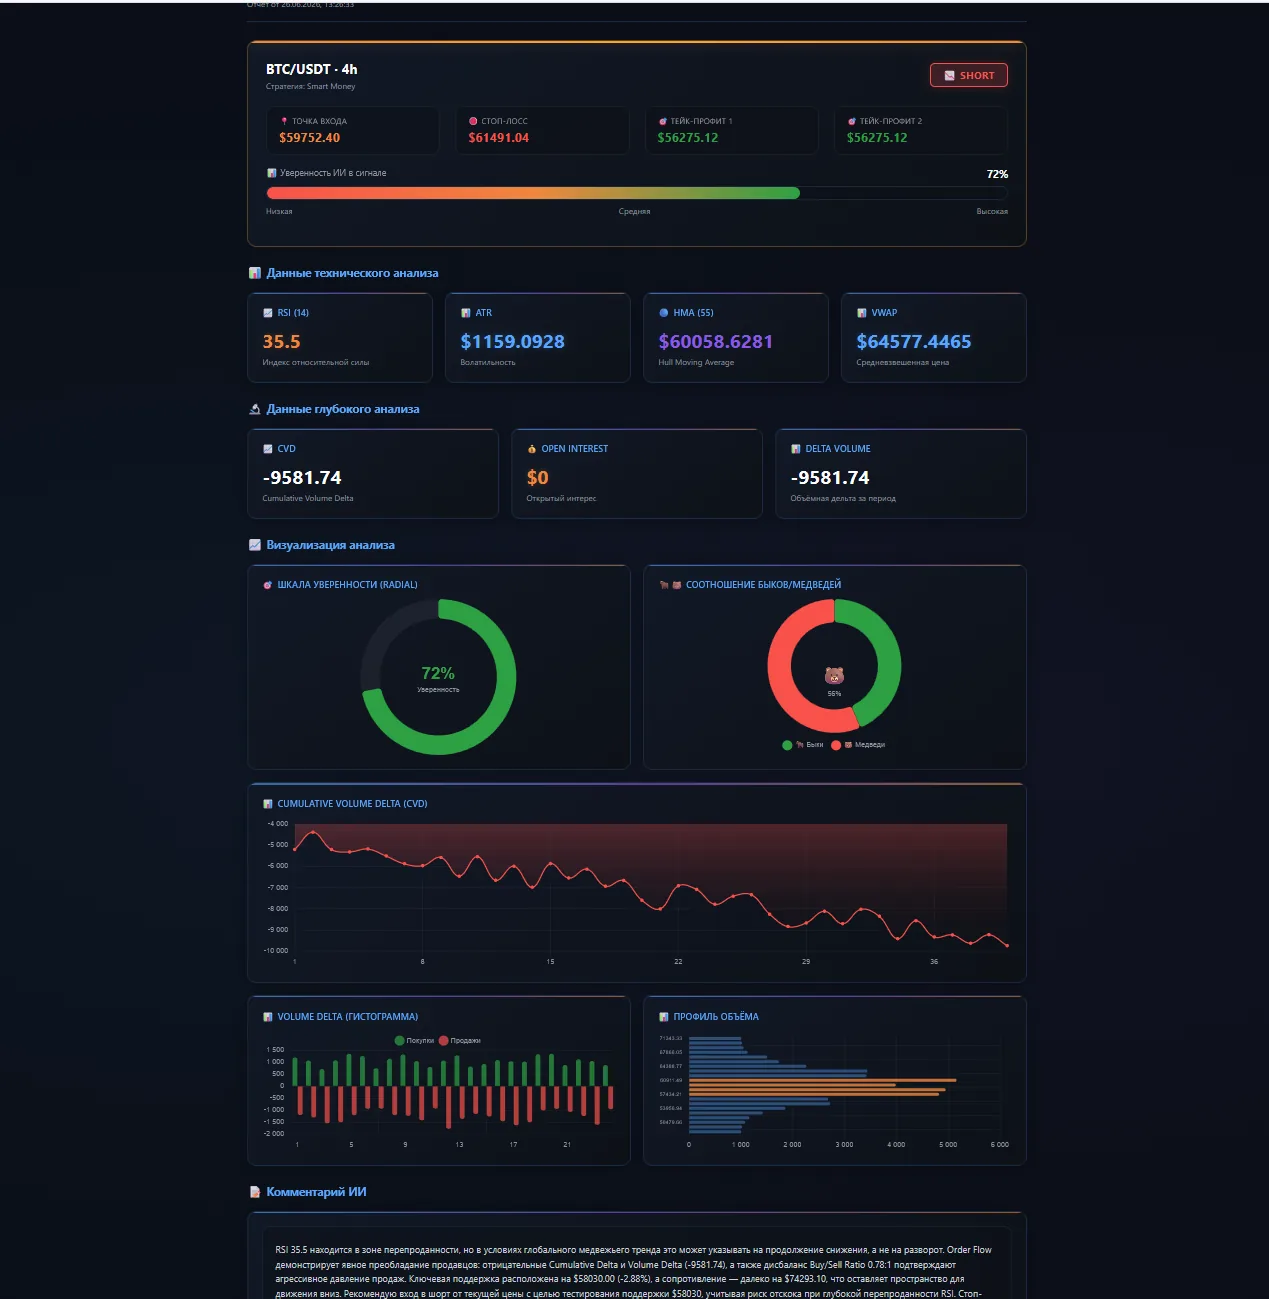
If you are new to the platform, follow this short path. It works the same on the main page and in Scalp Radar.
- Open the screener and set exchange, timeframe and market type (spot or futures) to narrow the list.
- Sort the coins using tabs: Volume, Gainers, Losers, Volatility, RSI < 30, RSI > 70, Support, Resistance.
- Open the coin in technical analysis and review RSI, ATR, moving averages, levels, Order Blocks and FVG.
- Check order flow in deep analysis: CVD and delta should confirm the move.
- Run AI analysis and treat entry, stop and targets as guidance, not a guarantee.
How the analysis pipeline works
The platform works as a pipeline: bulk screening → detailed review → order flow → final signal. This saves time: instead of analysing 200 coins manually, you first find candidates.
Scalping on 1m–15m is best done in Scalp Radar, while 1 hour and above is better on the main page.
Step 1. Market screener (scanner.html)
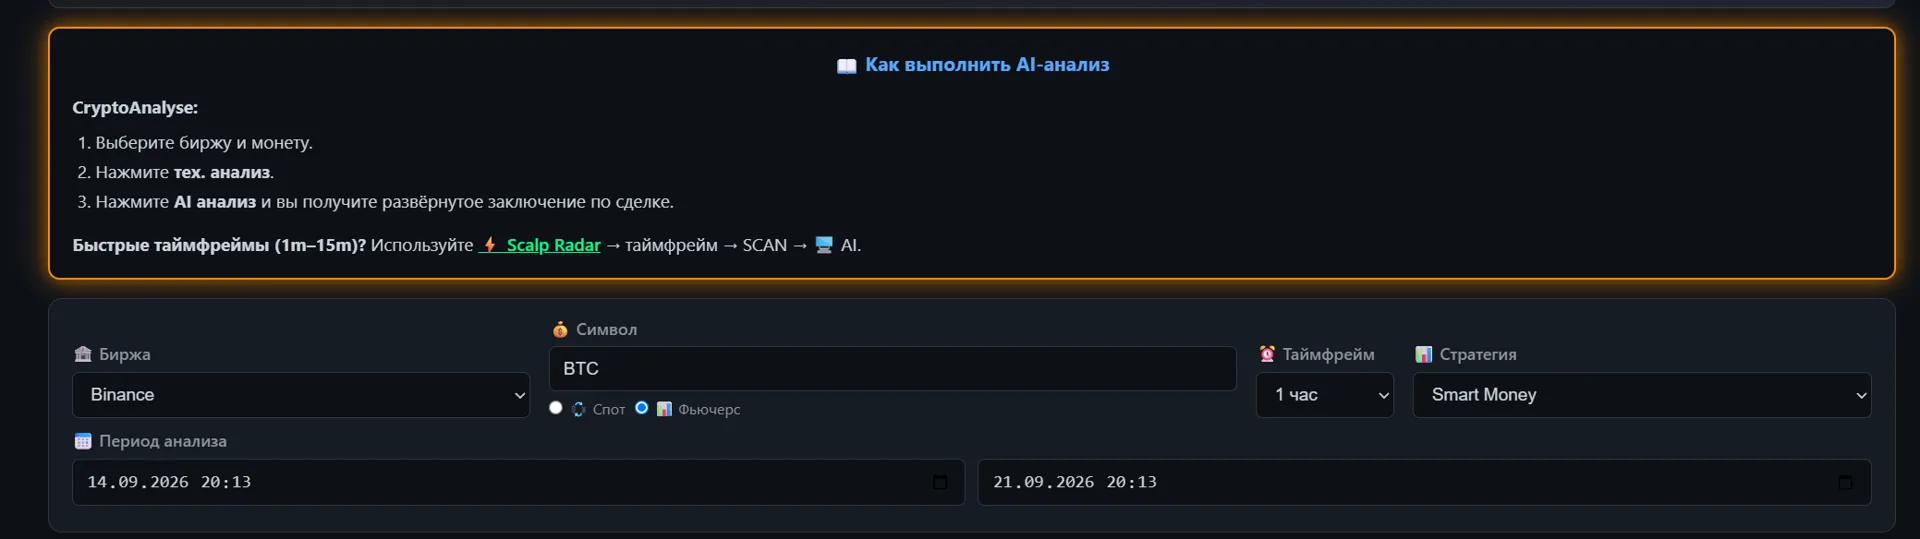
The screener is your entry point. It shows the whole market: volume, 24h and 7d changes, volatility, RSI, volume spikes, trend and the number of exchanges listing a coin.

💰 Volume
Highest 24h turnover. Liquidity is the base for entering and exiting without slippage.
📈 Gainers / 📉 Losers
Movement leaders. Useful to find trend continuation or a pullback after an impulse.
⚡ Volatility
Wide-range coins. More movement but more risk — a correct stop is essential.
🟢 RSI < 30 / 🔴 RSI > 70
Oversold and overbought zones: candidates for a bounce or reversal.
Step 2. Technical analysis (index.html)
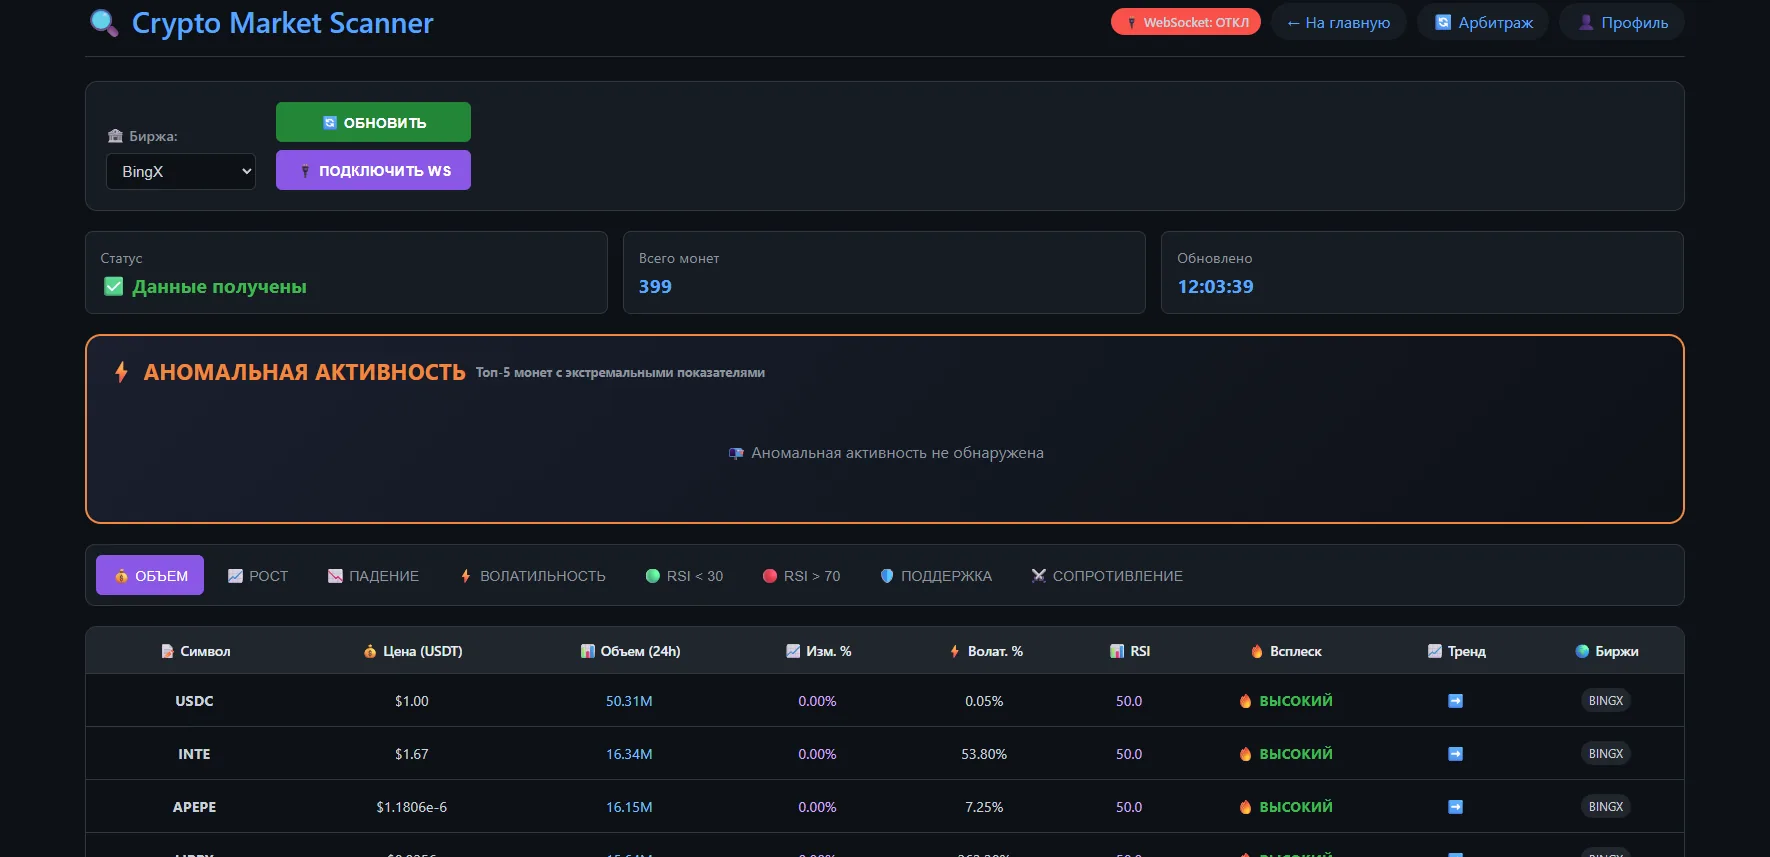
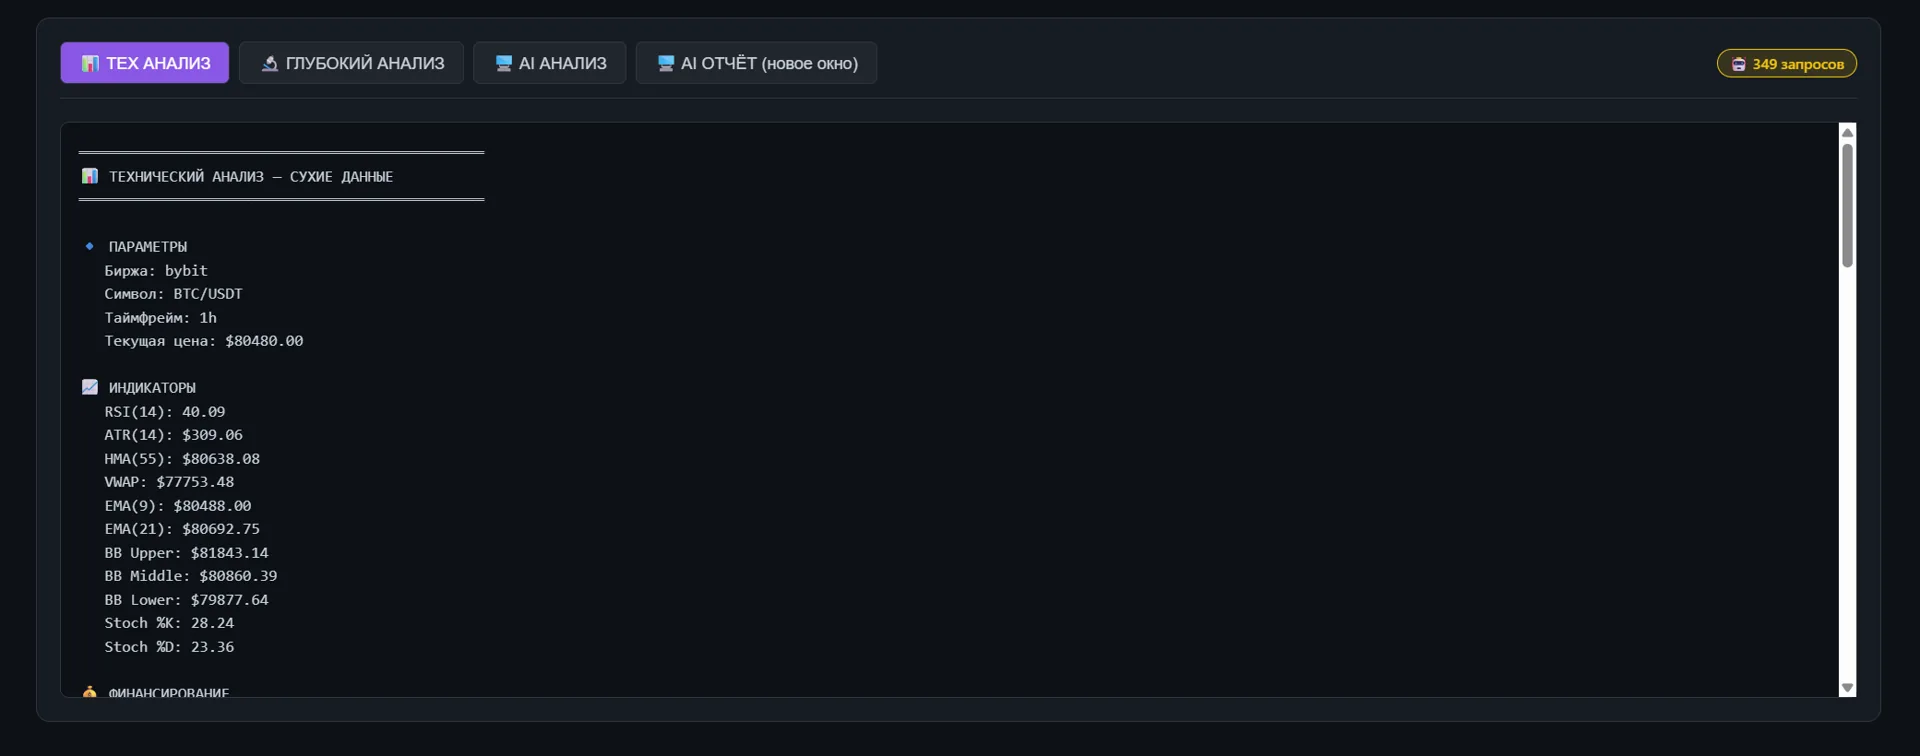
Here you review the chosen coin. Click "TECH ANALYSIS" and the platform computes indicators and structural levels, answering: what state is the market in and where are the logical levels?
What to check first
| Block | Meaning | How to use |
|---|---|---|
| Trend (Global / Local) | Direction on higher and lower scale | Trade with the higher trend, enter on the lower |
| RSI(14) | Momentum and overbought/oversold | <30 weakness, >70 overheated; extremes = caution |
| ATR(14) | Average movement range | Basis for the stop: higher ATR = wider stop |
| Support / Resistance (S1–S5, R1–R5) | Levels where price reacted before | Enter near support, take profit near resistance |
| Order Blocks / FVG | Zones of large-player interest | Find entries and targets |
| Volume spike | Abnormal activity | Confirms a breakout or reaction |
Step 3. Order flow deep dive
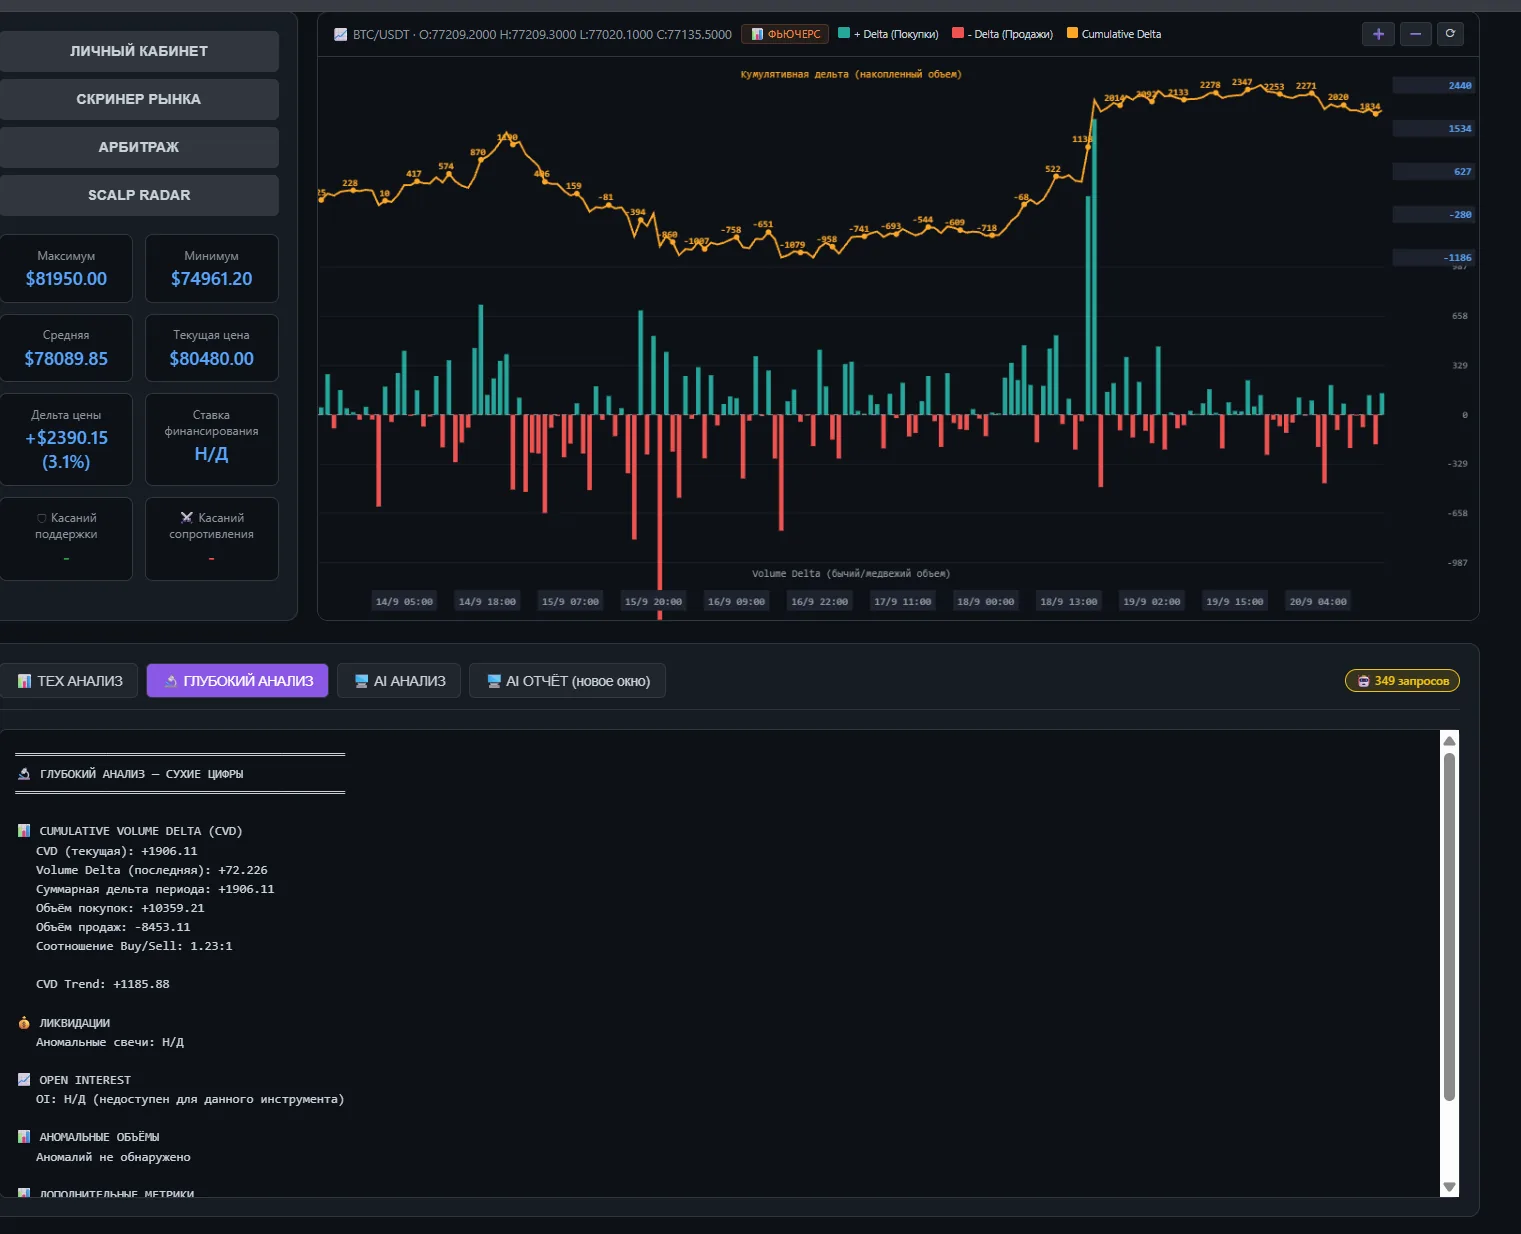
If technical analysis answers "where", deep analysis answers "who moves the price". Here you read CVD (cumulative delta), current and total delta, and buy/sell volume.
- Confirmation: price and CVD rise together — buyers truly support the move.
- Divergence: price rises while CVD falls — the move is hollow, reversal risk grows.
- Delta spike: a surge in flow often marks the start of an impulse.
Step 4. AI signal explained
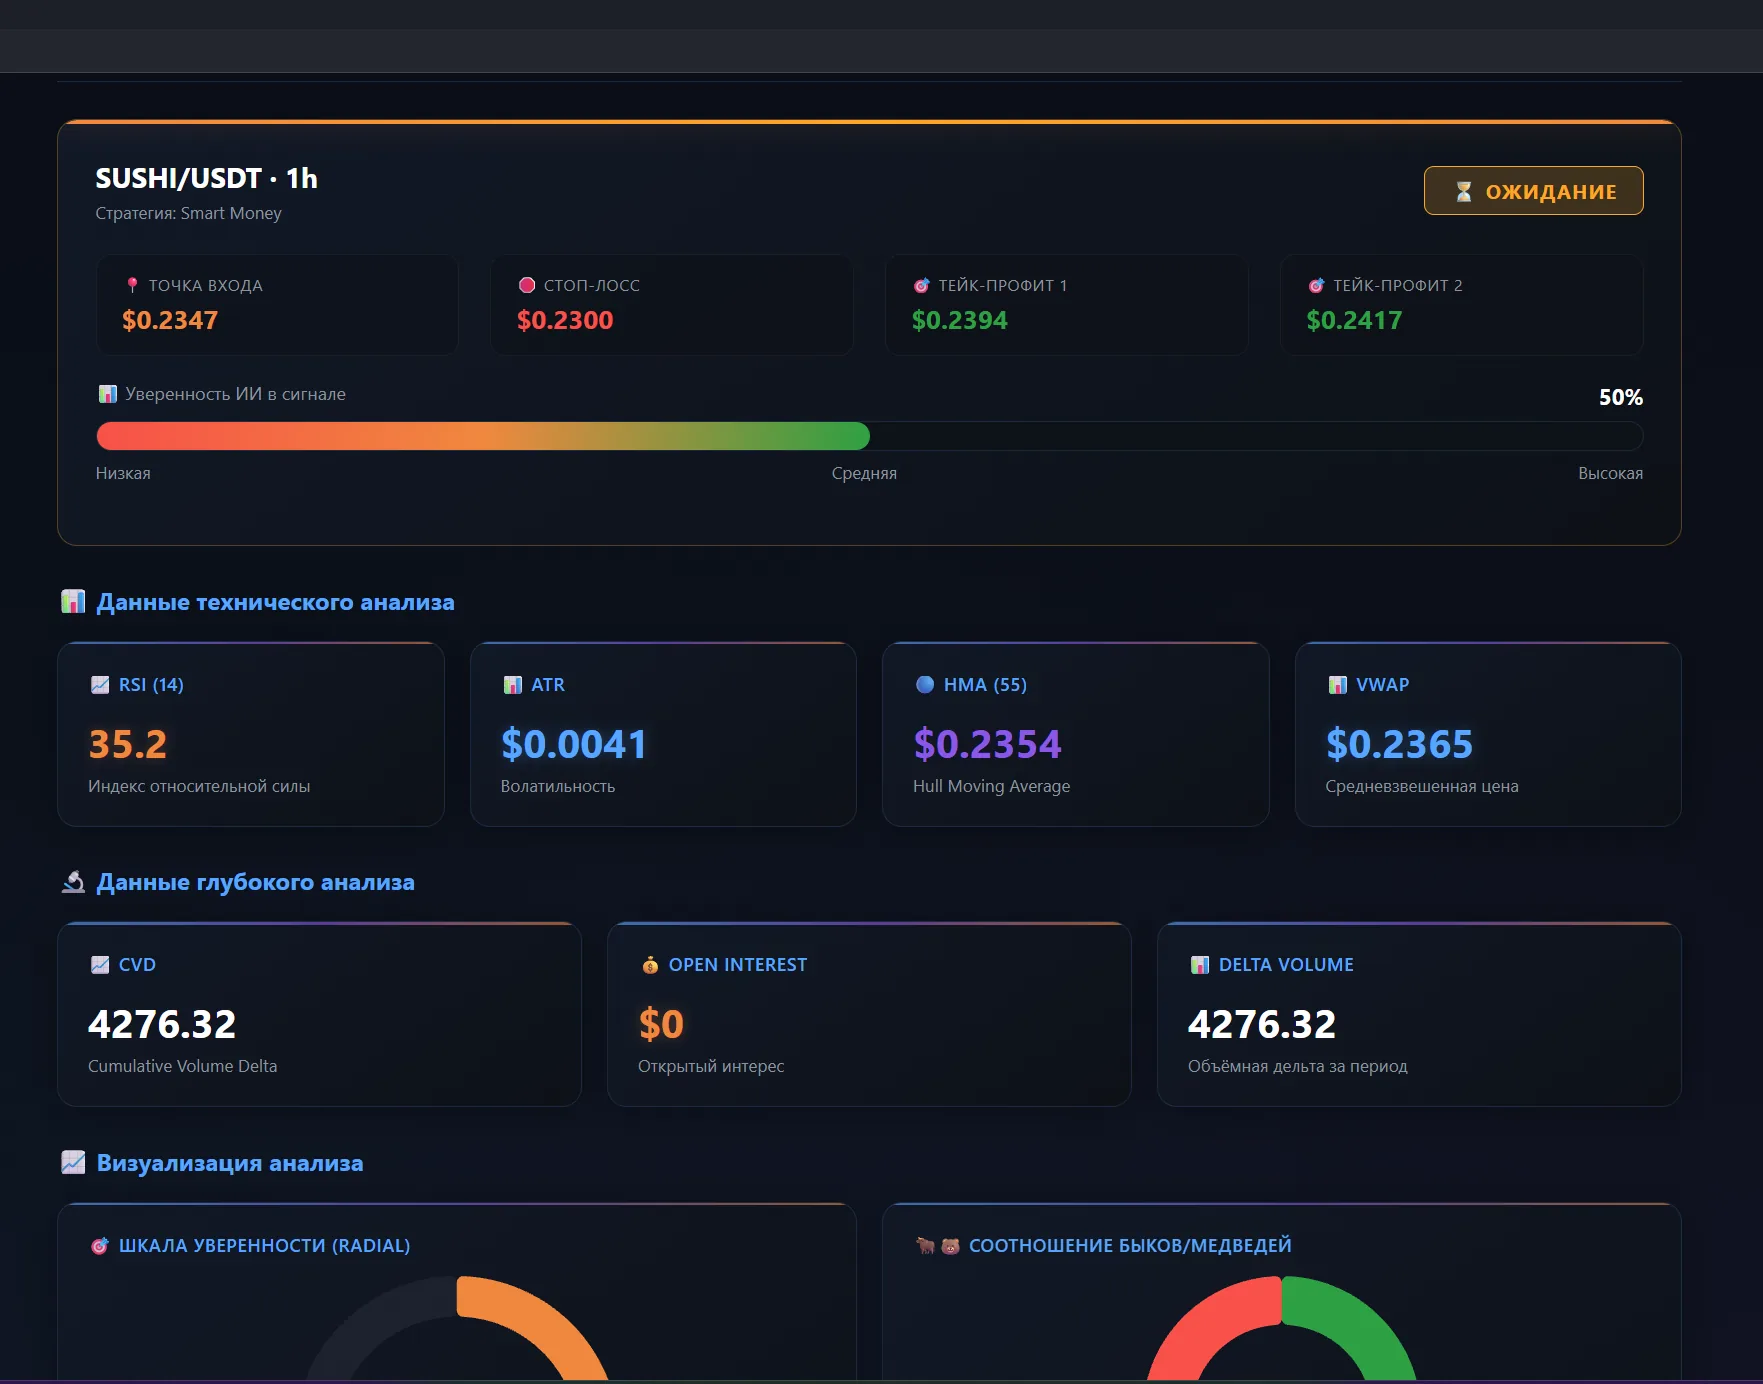
AI combines technical data and order flow into a final signal: direction, confidence and levels. It is the last stage of the pipeline, not a replacement for your own analysis.
- Confidence (0–100): below 65 means higher uncertainty and a weaker signal.
- Entry: reference for opening (the algorithm may suggest a limit entry when the stop is wide).
- Stop: risk limit, derived from volatility (ATR) and structure.
- TP1 / TP2: profit targets; targets are never closer than the stop.
Scalp Radar for fast trading (scalp-radar.html)
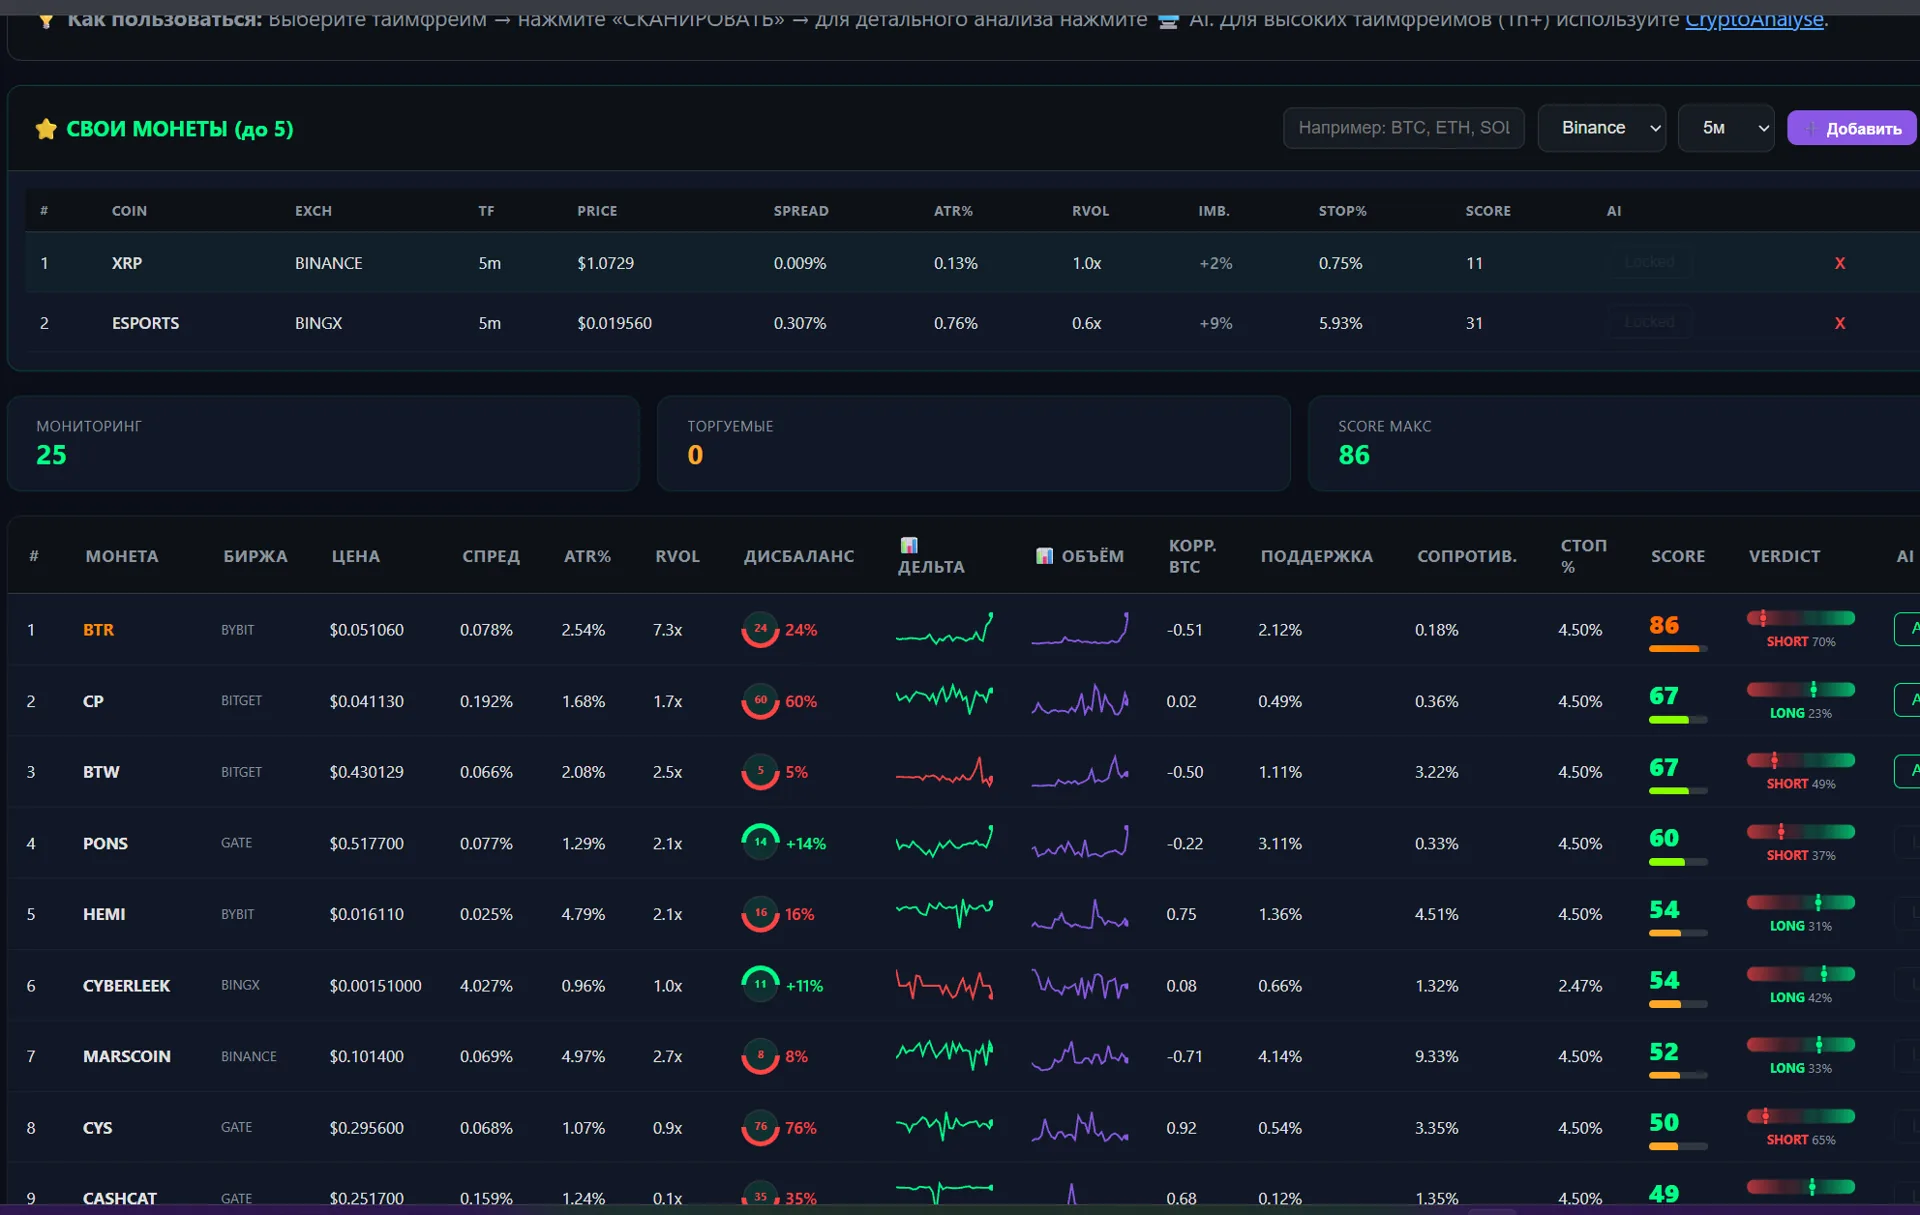
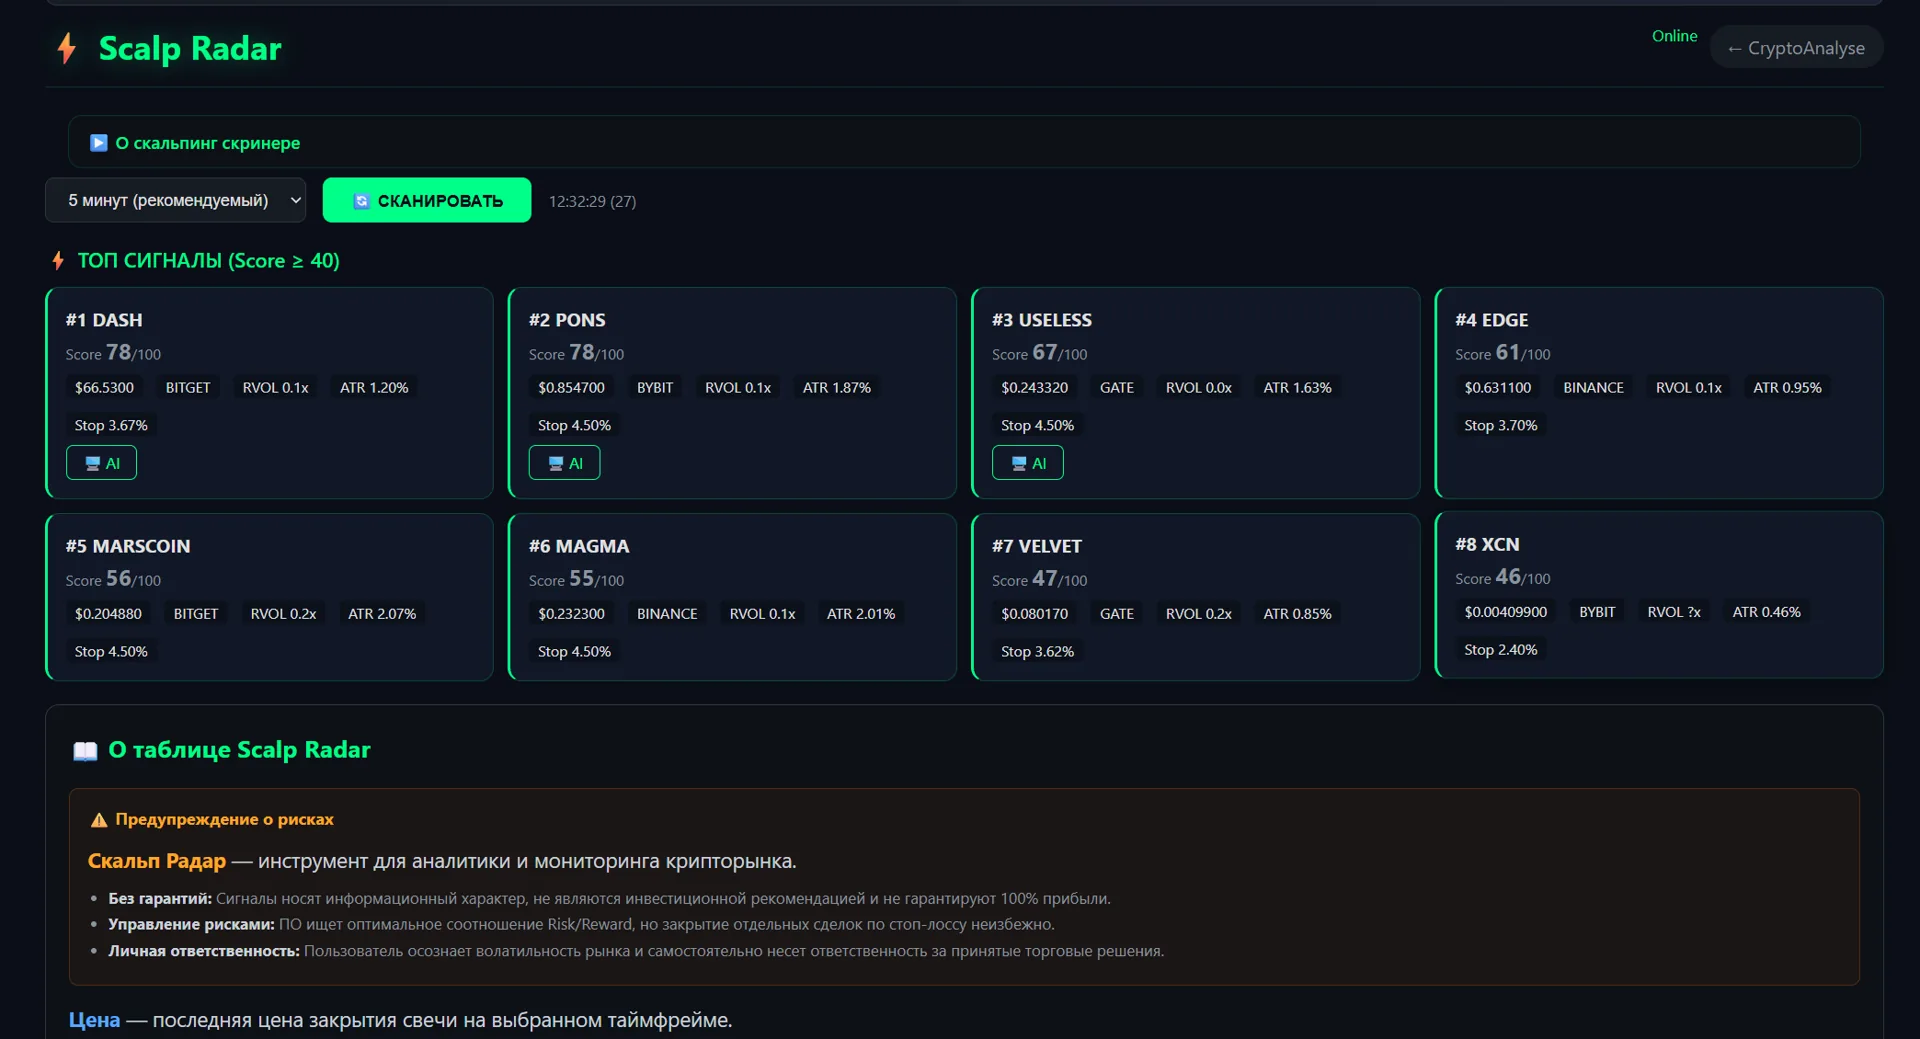
Scalp Radar is built for 1m, 5m and 15m. It scans the market and shows coins with abnormal activity plus a composite Score.
| Metric | Meaning | Guideline |
|---|---|---|
| Spread | Difference between bid and ask | < 0.02% = good liquidity |
| ATR% | Volatility on the timeframe | For 5m, ~0.3–1.2% is comfortable |
| RVOL | Volume vs average | >1.8x elevated, >3x abnormal |
| Imbalance | Order book skew | Above +20% = buyer pressure |
| BTC corr. | Correlation with Bitcoin | >0.5 = strong link |
| Score | Composite 0–100 | Strong signal from 80, AI available from 65 |
Indicators: what and why
| Indicator | Where | Shows | How to read |
|---|---|---|---|
| RSI(14) | Screener, index | Momentum and overbought | <30 oversold, >70 overbought; based on closed candles |
| ATR(14) | index, Scalp Radar | Volatility | Basis for the "Stop %" |
| HMA(55), EMA(9/21) | index | Trend | Price above = bullish; EMA crosses |
| VWAP | index | Volume-weighted average price | Magnet and intraday level |
| Bollinger | index | Volatility and bands | Squeeze before impulse, band touches |
| Stoch %K/%D | index | Momentum | Crosses in the 20/80 zones |
| Funding Rate | index (futures) | Position overheating | Extremes = squeeze risk; N/A for spot |
| Volume / RVOL | Screener, Scalp Radar | Volume activity | A spike confirms a move |
| Delta / CVD | Deep analysis, Scalp Radar | Buy/sell pressure | Divergence with price = reversal signal |
| Support / Resistance | index, Screener | Reaction levels | Bounces and breakouts |
Smart Money: OB, FVG, liquidity
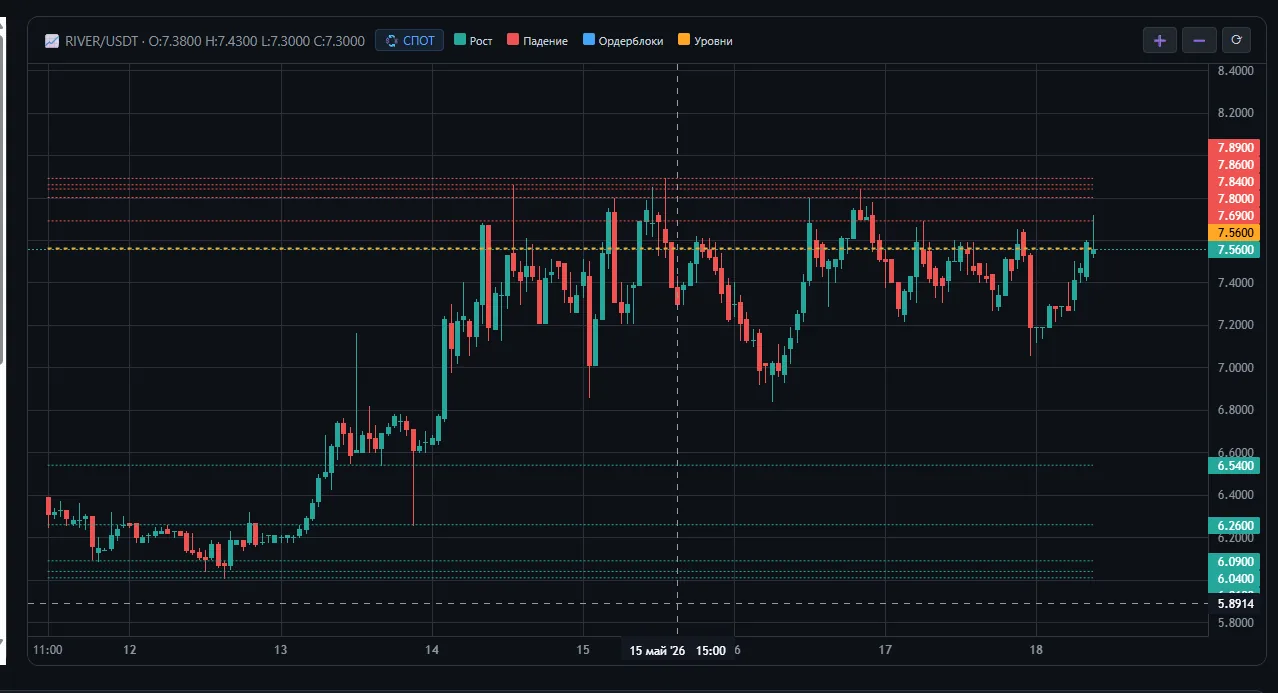
Smart Money looks for zones where large participants accumulated or distributed positions. The platform marks them automatically.
Order Block
The last candle before an impulse where positions were accumulated. Often acts as support/resistance.
FVG (imbalance)
A price gap between candles. Price often returns to close it.
Liquidity
A cluster of stops beyond extremes. Price often moves there before reversing.
CHoCH / BOS
Change of character and break of structure — confirmation of reversal or continuation.
Algorithm tips
- Volatility-based stop. "Stop %" = ATR × timeframe multiplier + fee. Higher volatility means a wider stop, otherwise noise takes you out.
- Limit entry. If the calculated stop is too wide, the algorithm may suggest a limit entry instead of a market one — read the note in the signal.
- Signal logic. Targets are never closer than the stop, and TP1 is never beyond TP2. If you see otherwise, it is a bug worth reporting.
- Spot vs futures. Funding Rate and open interest only make sense on futures; spot shows N/A.
- Timeframes. 1m–15m for Scalp Radar; 1h and above on the main page with full technical analysis.
- Liquidity and memecoins. Wide spread and high ATR raise slippage risk: check spread and RVOL, reduce position size.
- Order beats signals. Screen first, then confirm structure and order flow, then use AI.
- Combinations. Volume spike + extreme RSI + support/Order Block; or CVD divergence + CHoCH.
Worked example: screener to trade
- Screener: on the Volume tab we find a coin with a volume spike and RSI near 30.
- Technical analysis: price sits at support that coincides with an Order Block, local trend is up.
- Order flow: CVD rises with price — buyers confirm the bounce, no divergence.
- AI signal: confidence above 65, entry from support, stop below the Order Block, TP1 and TP2 at resistance levels.
- Risk management: risk per trade is capped and position size is derived from the stop distance.
Common mistakes
- Trading a signal without checking trend and levels.
- Ignoring liquidity and spread on low-cap coins.
- Placing a stop tighter than volatility (ATR) — noise takes it out.
- Deciding on a forming candle.
- Using scalp timeframes for swing ideas and vice versa.
- Treating AI analysis as a profit guarantee.
Interface gallery
FAQ
Where do I start on CryptoAnalyse?
Start with the market screener: it surfaces coins with abnormal volume, volatility and extreme RSI. Open candidates in technical analysis.
What is Score and which threshold is strong?
Score is a 0–100 composite in Scalp Radar. Values of 80 and above flag a strong signal, and AI analysis is available from 65.
How is Scalp Radar different from the main page?
Scalp Radar is built for 1m, 5m and 15m and bulk coin selection. Use the main page for 1h and higher.
How do I read CVD?
CVD is cumulative buying versus selling pressure. Moving with price confirms the trend; divergence warns of a reversal.
What do entry, stop and targets mean?
Entry is a reference for opening, stop limits risk, TP1 and TP2 are profit targets. Targets are never closer than the stop.
Is this investment advice?
No. Analysis and signals are informational. Trading crypto carries high risk.