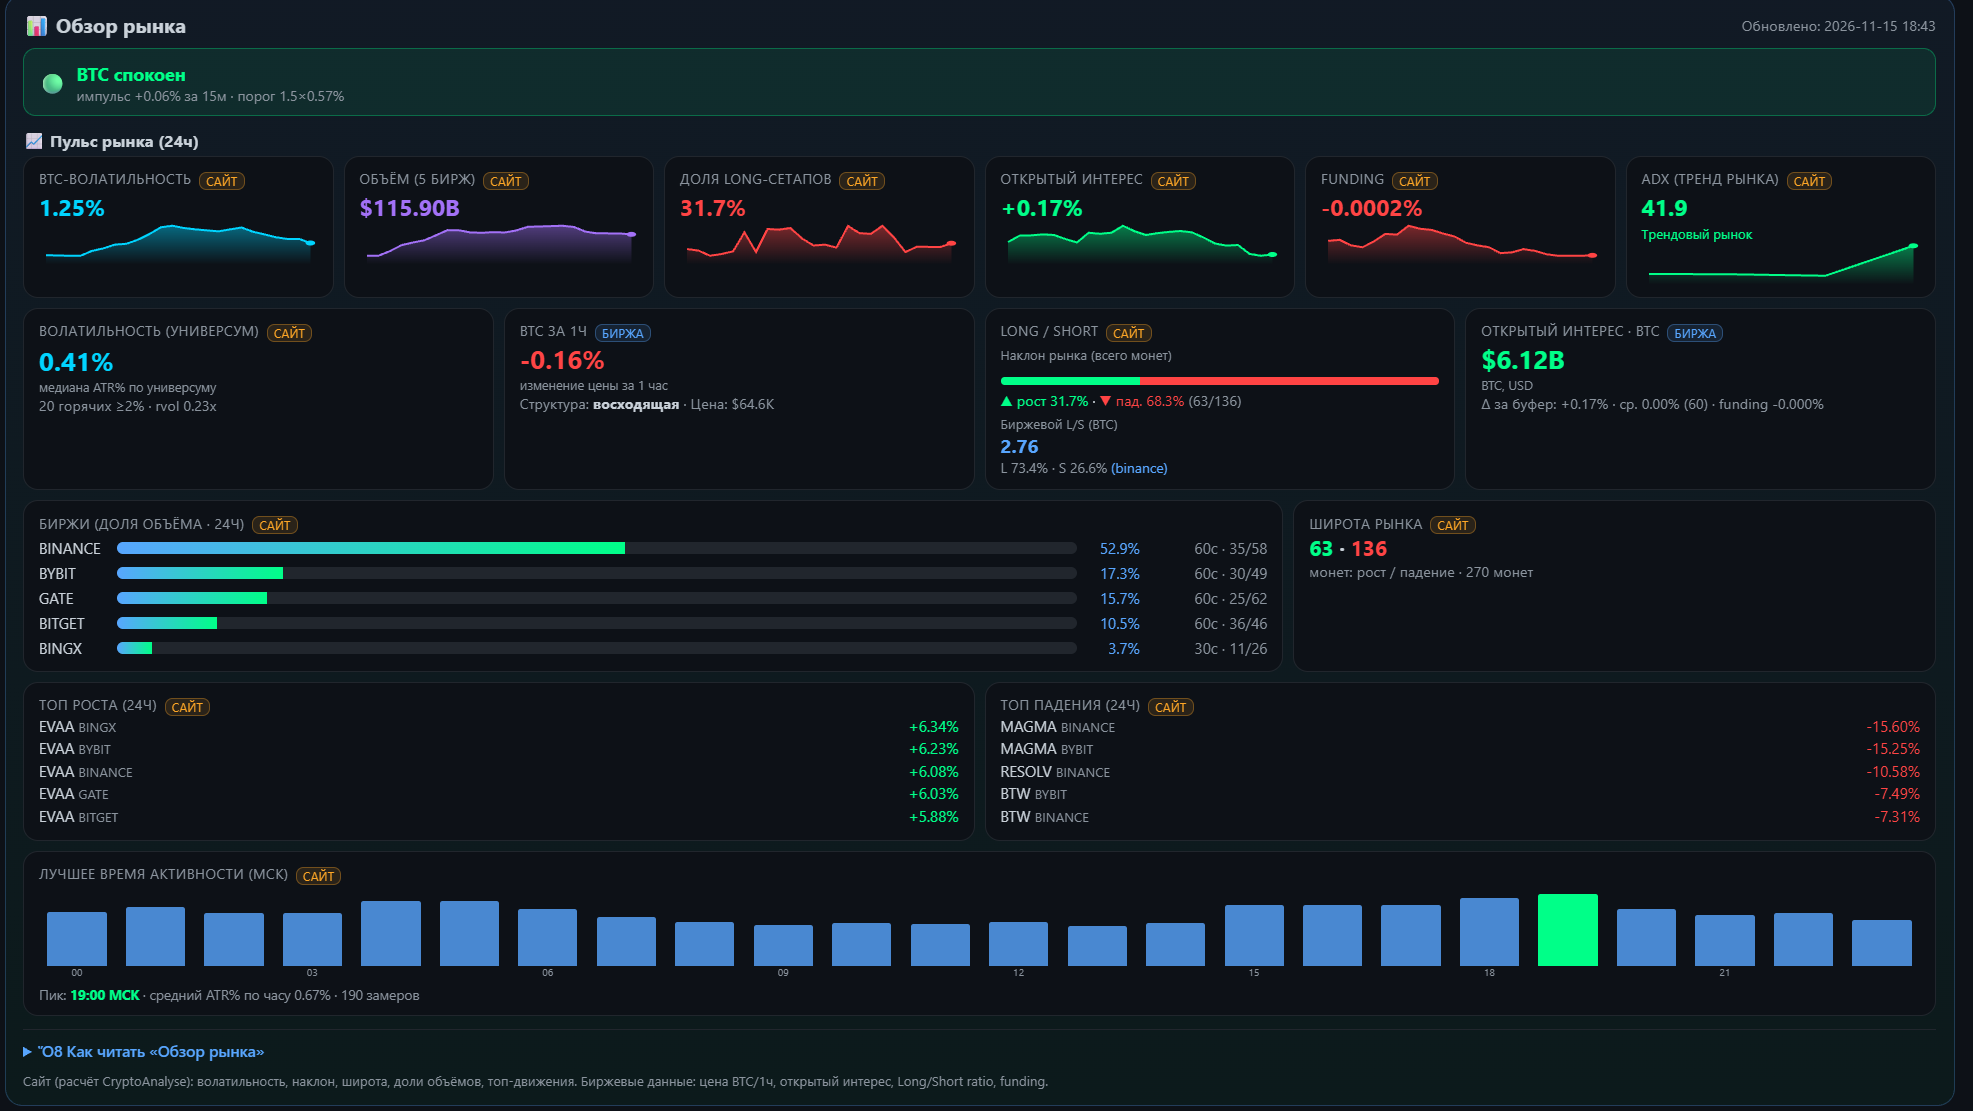
15.11.2026 — Two improvements have appeared in the "Market Review" section on CryptoAnalyse.
1. ADX — trend or sideways movement across the market. A sixth "Market Pulse" curve has been added — the average ADX of all coins over 24 hours. Thresholds: below 20 — "Market in sideways movement", 20–25 — transitional mode, above 25 — "Trending market". This is a quick reference: in sideways movements, trends "continue" worse, in a trend — the opposite.
2. "Best Activity Time (MSK)" — now a bar chart. On the vertical axis — average activity (average ATR% per hour), on the horizontal axis — 24 hours; peak hour is highlighted, below the graph the peak and the volume of accumulated data are indicated. History is collected automatically every hour (currently ~8 days, 189 measurements).